Mxwll Price Action Suite [Mxwll]Introducing the Mxwll Price Action Suite!
The Mxwll Price Action Suite is an all-in-one analysis indicator incorporating elements of SMC and also ideas extending beyond the trading methodology!
Features
Internal structures
External structures
Customizable Sensitivities
BoS/CHoCH
Order Blocks
HH/LH/LL/LH Areas
Rolling TF highs/lows
Rolling Volume Comparisons
Auto Fibs
And more!
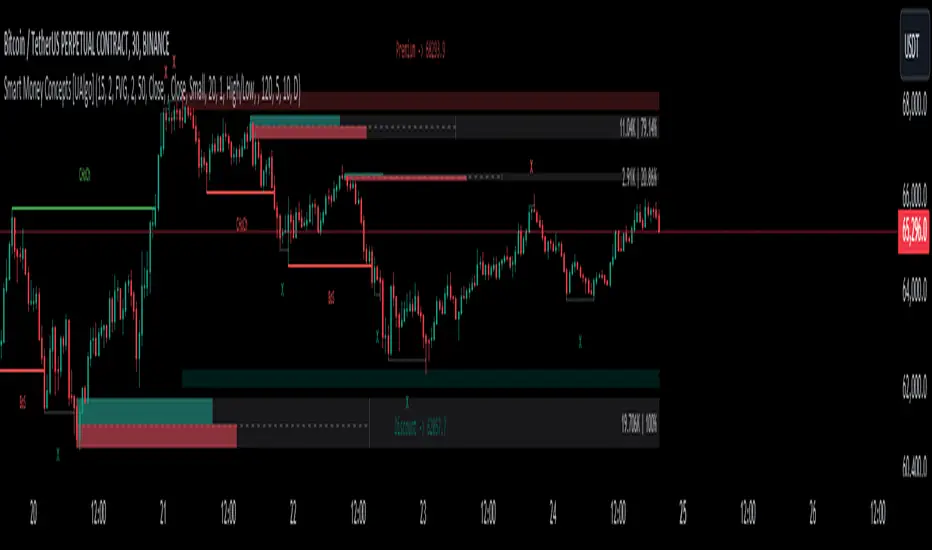
The image above shows the indicator's market structure identification capabilities. Internal BoS and CHoCH structures in addition to overarching market structures are available with customizable sensitivities.
The image above shows the indicator identifying order blocks! Additionally, HH/LH/LL/LH areas are also identified.
The image above shows a rolling area of interest. These areas can be compared to supply/demand zones, where traders might consider a bargain long/short/sell area.
The indicator displays a rolling 4hr high/low and 1D high/low, alongside auto fibonacci levels with a customizable sensitivity.
Finally, the Mxwll Price Action Suite shows relevant session information.
Table information
Current Session
Countdown to session close
Next Session
Countdown to next session open
Rolling 4-Hr volume intensity
Rolling 24-Hr volume intensity
Introducing the Mxwll SMC Suite!
The Mxwll SMC Suite is an all-in-one analysis indicator incorporating elements of SMC and also ideas extending beyond the trading methodology!
Features
Internal structures
External structures
Customizable Sensitivities
BoS/CHoCH
Order Blocks
HH/LH/LL/LH Areas
Rolling TF highs/lows
Rolling Volume Comparisons
Auto Fibs
And more!
The image above shows the indicator's market structure identification capabilities. Internal BoS and CHoCH structures in addition to overarching market structures are available with customizable sensitivities.
The image above shows the indicator identifying order blocks! Additionally, HH/LH/LL/LH areas are also identified.
The image above shows a rolling area of interest. These areas can be compared to supply/demand zones, where traders might consider a bargain long/short/sell area.
The indicator displays a rolling 4hr high/low and 1D high/low, alongside auto fibonacci levels with a customizable sensitivity.
Finally, the Mxwll Price Action Suite shows relevant session information.
Table information
Current Session
Countdown to session close
Next Session
Countdown to next session open
Rolling 4-Hr volume intensity
Rolling 24-Hr volume intensity
Expanded Features of Mxwll Price Action Suite
Internal and External Structures
Internal Structures: These elements refer to the price formations and patterns that occur within a smaller scope or a specific trading session. The suite can detect intricate details like minor support/resistance levels or short-term trend reversals.
External Structures: These involve larger, more significant market patterns and trends spanning multiple sessions or time frames. This capability helps traders understand overarching market directions.
Customizable Sensitivities
Adjusting sensitivity settings allows users to tailor the indicator's responsiveness to market changes. Higher sensitivity can catch smaller fluctuations, while lower sensitivity might focus on more significant, reliable market moves.
Break of Structure (BoS) and Change of Character (CHoCH)
BoS: This feature identifies points where the price breaks a significant structure, potentially indicating a new trend or a trend reversal.
CHoCH: Detects subtle shifts in the market's behavior, which could suggest the early stages of a trend change before they become apparent to the broader market.
Order Blocks and Market Phases
Order Blocks: These are essentially price levels or zones where significant trading activities previously occurred, likely pointing to the positions of smart money.
HH/LH/LL/LH Areas: Identifying Higher Highs (HH), Lower Highs (LH), Lower Lows (LL), and Lower Highs (LH) helps in understanding the trend and market structure, aiding in predictive analysis.
Rolling Timeframe Highs/Lows and Volume Comparisons
Tracks highs and lows over specified rolling periods, providing dynamic support and resistance levels.
Compares volume data across different timeframes to assess the strength or weakness of the current price movements.
Auto Fibonacci Levels
Automatically calculates and plots Fibonacci retracement levels, a popular tool among traders to identify potential reversal points based on past movements.
Session Data and Volume Intensity
Session Information: Displays current and upcoming trading sessions along with countdown timers, which is crucial for day traders and those trading on session overlaps.
Volume Intensity: Measures and compares the volume within the last 4 hours and 24 hours to gauge market activity and potential breakout/breakdown movements.
Visualizations and Practical Use
Dynamic Visuals: The suite provides dynamic visual aids, such as real-time updating of high/low markers and Fibonacci levels, which adjust as new data comes in. This feature is critical in fast-paced markets.
Strategic Entry/Exit Points: By identifying order blocks and using Fibonacci levels, traders can pinpoint strategic entry and exit points, maximizing potential returns.
Risk Management: Enhanced features like session countdowns and volume intensity help in better risk management by providing traders with more data on market sentiment and potential volatility.
חפש סקריפטים עבור "order block"

[AlbaTherium] MTF External Ranges Analysis - ERA-Orion for SMC MTF External Ranges Analysis - ERA - Orion for Smart Money Concepts
Introduction:
The MTF External Ranges Analysis - ERA - Orion offers enhanced insights into multi-timeframe external structure points, swing structure points, POIs (Points of Interest), and order blocks (OB) . By incorporating this enhancement, your multi-timeframe analysis are streamlined, simplifying the process and reducing chart workload, no need for manual chart drawing anymore, stay focus on Low Time Frame and get High Time Frame insights in one single Time frame.
This identification process remains effective even when focusing on Lower Time Frames (LTF), providing detailed insights without sacrificing the broader market perspective.
The MTF External Ranges Analysis - ERA – Orion is specifically designed to be used in conjunction with OptiStruct™ Premium for Smart Money Concepts . This strategic combination enhances the workflow of identifying optimal entry points. OptiStruct acts as the analysis tool for Lower Time Frames (LTF), zeroing in on immediate interest areas, while Orion expands this analysis to Higher Time Frames (HTF), providing a broader view of market trends and importants key levels . The integration of Orion with OptiStruct seamlessly merges LTF and HTF analyses, ensuring a thorough understanding of market dynamics for informed and strategic decision-making. This toolkit in one package assembly is pivotal for traders relying on Smart Money Concepts, offering unmatched clarity and actionable insights to navigate the markets effectively.
This tool offers an advanced smart money technical analysis to improve your trading experience. It introduces four key concepts:
Main Features:
Entries Enhancements
Inducements HTF
High/Low Markings HTF
Multiple Timeframes and Confluences on Extreme, Dec and SMT Order Blocks
By integrating these concepts into one, traders can identify high-probability zones across multiple timeframes and develop a thorough understanding of market dynamics. These confluence zones enhance order block skills and potential, establishing them as essential pillars in smart money trading strategies and enabling traders to make more informed decisions.
Settings Overview:
HTF Settings Enable HTF Analysis
Select timeframe {Select or 4H Chart}
Labels Alignment for Lines and Boxes
Inside bar ranges HTF
Break of Structure /Change of Character HTF
Inducements HTF
High/Low Markings HTF
High/Low Sweeps HTF
Extreme Order Blocks HTF
Decisional Order Blocks HTF
Smart Money Traps HTF
IDM Demands and Supplies HTF
Historical Order Blocks HTF
OB Mitigation HTF {touch/ extended}
Understanding the Features:
Chapter 1: Entries Enhancements
In this chapter, we delve into strategies to refine trading entries, focusing on the multi-timeframe analysis of extreme or decisional order blocks in the High Time Frame timeframe as a key point of interest. We highlight the significance of transitioning to the Low Time Frame chart for observing pivotal shifts in market behavior. By examining these concepts, traders can gain deeper insights into market dynamics and make more informed entries decisions at critical junctures.
Practical Example:
We had an Order Block Extreme on the 1-hour timeframe, and currently, we are on the recommended chart for trade entry, which is the 5-minute timeframe. We are patiently waiting to observe a 5-minute ChoCh in the market to enter a buying position since it's an OB Extreme Demand on the 1-hour timeframe. Here, it's crucial and important to focus on the entry timeframe rather than checking what's happening in the higher timeframe. The indicator facilitates this task as it provides us with real-time perspective and visibility of everything happening in the higher timeframe.
Chapter 2: Inducements HTF
It is important and useful to be aware of the various liquidity points across the different timeframes we use; sometimes, a reliable entry point in the Lower Time Frame (LTF) may be surrounded by inducements. Consequently, this point becomes unreliable, and prior to the arrival of this functionality, such anomalies could not be detected, especially when focusing on the market in the LTF. From now on, there will be no more such issues.
Practical Example:
Suppose we identify an Order Block Extreme on the 5M timeframe, indicating a potential entry level. However, when we switch to the 5M timeframe to look for an entry point, we observe an accumulation of inducements around this Order Block coming from a higher timeframe, whether it's M15 or H1. This suggests a potential weakness in the entry point and significant market liquidity, which will act as a trap zone. Before the introduction of this feature, we might have missed this crucial observation, but now we can detect these anomalies and adjust our strategy accordingly.
The only practical way to see theses confluences is to use this Indicator, see the example below
Chapter 03: High/Low – Bos - ChoCh Markings HTF
The High/Low Markings HTF feature in the MTF External Ranges Analysis - ERA - Orion provides a comprehensive view into the market's heartbeat across different timeframes, right from within the convenience of the Lower Time Frame (LTF). It meticulously highlights pivotal shifts, allowing traders to seamlessly discern market sentiment and anticipate potential price reversals without needing to toggle between multiple charts. This innovation ensures that critical market movements and sentiment across various timeframes are visible and actionable from a single, focused LTF perspective, enhancing decision-making and strategic planning in trading activities.
Understanding High/Low Markings in HTF Analysis
High/Low Markings in High Time Frame (HTF) analysis mark the market's extremities within a given period, pinpointing potential areas for reversals or continuation and delineating crucial support and resistance levels. These markings are not arbitrary but represent significant market responses, serving as essential indicators for traders and analysts to gauge market momentum and sentiment.
The Role of HTF in Market Analysis
HTF analysis extends a comprehensive view over market movements, distinguishing between ephemeral fluctuations and substantial trend shifts. By scrutinizing these high and low points across wider time frames, analysts can unravel the underlying market momentum, enabling more strategic, informed trading decisions.
Identifying High/Low Markings
Identifying these crucial points entails detailed chart analysis over extended durations—daily, weekly, or monthly. The search focuses on the utmost highs and lows within these periods, which are more than mere points on a chart. They are significant market levels that have historically elicited robust market reactions, serving as key indicators for future market behavior.
Real-world Example:
Chapter 04: Multiple Timeframes and Confluences on Extreme, Dec and SMT Order Blocks Across HTF
The Orion indicator serves as a bridge between the multiple dimensions of the market, enabling a unified and strategic interpretation of potential movements. It's an indispensable tool for those seeking to capitalize on major opportunity zones, where the convergence of diverse perspectives creates ideal conditions for significant market movements.
Designed to navigate through the data of different timeframes and market analysis, Orion provides a clear and consolidated view of major points of interest. With this indicator, traders can not only spot opportunity zones where consensus is strongest but also adjust their strategies based on the dynamic interaction of various market participants, all while remaining within the Lower Time Frame (LTF).
Conclusion:
MTF External Ranges Analysis - ERA - Orion for Smart Money Concepts as “ The Orion ” indicator captures consensus among scalpers, day traders , swing traders, and investors, turning key areas into major opportunities. It allows for precise identification of areas of interest by analyzing the convergence of actions from various market participants. In short, Orion is crucial for detecting and leveraging the most promising points of convergence in the market.
This identification occurs even while focusing on Lower Time Frames (LTF), allowing for detailed insights without losing the broader market perspective.
This document provides an extensive overview of MTF External Ranges Analysis - ERA - Orion , emphasizing its importance in comprehending market dynamics and utilizing essential smart money concepts trading principles.

Smart Money Concepts [UAlgo]🔶 Description:
Smart Money Concepts (SMC) refer to a trading strategy that revolves around understanding and following the actions of institutional investors, such as banks and hedge funds, who are considered the “smart money” in the market. The concept is based on the idea that these institutions have more information and resources, and thus their market activities can indicate future market movements.
This script designed to be a tool that will automatically provide many features related to SMC concept for investors, offering a market structure analysis that includes the identification of order blocks, breaker blocks, and liquidity points. It also delineates premium and discount zones, highlights Fair Value Gaps (FVG), Volume Imbalance (VI) and Order Gap (OG) areas, providing users with a multifaceted view of market dynamics.
🔶 Key Features:
Market Structure Analysis : Simplifies the overview of market behavior, identifies market breakouts or trend continuation.
It detects the market structure as shown in the image below :
Order Blocks : Detects Order Blocks based on market structure analysis and volume characteristics. It draws these blocks and provides information such as volume.
Order Block Identification:
Breaker Blocks : Detects Breaker Blocks based on market structure analysis.
Breaker Block Identification:
When Order Block above is broken,
As you can see, it has now turned into a Bearish Breaker Block,
And it seems that the price is getting a reaction from this breaker block above.
Liquidity Sweeps : Tracks liquidity sweeps on both the buy and sell sides, offering traders a perspective on market momentum and potential shifts.
Multi-Timeframe Fair Value Gap (FVG), Volume Imbalance (VI), Order Gaps (OG) Detection : Detects Fair Value Gap (FVG), Volume Imbalance (VI) and Order Gaps (OG) based on different criteria such as price movements and volume characteristics. It marks these gaps/voids and provides visual cues for analysis.
Examle for FVG:
Premium & Discount Zone Analysis : Analyzes premium and discount zones, showing prices within these zones and highlighting equilibrium (0.5) levels.
Customizable Options : Provides various input parameters for customization, such as market structure length, sensitivity settings, display preferences, and mitigation methods.
Previous Key Levels : Identifies previous key levels include previous highs, lows, equilibrium points, and open prices across different timeframes such as daily, weekly, and monthly.
🔶 Disclaimer:
Use with Caution: This indicator is provided for educational and informational purposes only and should not be considered as financial advice. Users should exercise caution and perform their own analysis before making trading decisions based on the indicator's signals.
Not Financial Advice: The information provided by this indicator does not constitute financial advice, and the creator (UAlgo) shall not be held responsible for any trading losses incurred as a result of using this indicator.
Backtesting Recommended: Traders are encouraged to backtest the indicator thoroughly on historical data before using it in live trading to assess its performance and suitability for their trading strategies.
Risk Management: Trading involves inherent risks, and users should implement proper risk management strategies, including but not limited to stop-loss orders and position sizing, to mitigate potential losses.
No Guarantees: The accuracy and reliability of the indicator's signals cannot be guaranteed, as they are based on historical price data and past performance may not be indicative of future results.
[JL] Fractals ATR BlockI decided to combine Fractal ROC , ATR Break, and Order Blocks to an Indicator
The Fractal ROC , ATR Break, and Order Blocks indicator combines three concepts to help traders identify potential trade opportunities and manage risk. By using a combination of Fractal ROC , ATR Break, and Order Blocks, traders can gain a deeper understanding of market dynamics and make more informed trading decisions.
Fractal ROC is a momentum-based indicator that calculates the rate of change of the price between fractals, which are turning points in the market. It is calculated by taking the difference between the closing price and the lowest price in the previous n+1 periods, and dividing it by the difference between the open price 2n periods ago and the lowest price in the previous n+1 periods. This calculation is done for both up and down fractals. When the Fractal ROC value is greater than the ROC Break Level (as determined by the input variable roclevel), it indicates a potential momentum shift in the market. This can be used to identify potential trade entries or exits, depending on your trading strategy.
ATR Break is an indicator that helps traders identify significant price movements in the market. It measures the distance between the price and the Average True Range (ATR), which is a measure of the volatility of the market. ATR Break is calculated by taking the difference between the close and high/low, and dividing it by the previous ATR value. This calculation is done for both up and down movements. When the ATR Break value is greater than the ATR Break Level (as determined by the input variable atrlevel), it indicates a significant move in the market. This can be used to identify potential breakouts or breakdowns, and can be used to set stop-loss and take-profit levels.
An Order Block is a price level where significant buying or selling activity has taken place. The order blocks made by ATR Break and Fractal ROC are drawn using boxes on the chart. When the ATR or Fractal ROC level is breached, a box is drawn with the high and low of the candle that breached the level as the top and bottom of the box, respectively. The box is then extended to the right until the end of the chart or until another ATR or Fractal ROC level is breached, at which point a new box is drawn. This allows traders to easily identify significant price movements and potential support and resistance levels on the chart. When an Order Block is identified, it can be used as a potential support or resistance level . If price approaches an Order Block from below, it is likely to bounce off this level and continue in an upward direction. Similarly, if price approaches an Order Block from above, it is likely to bounce off this level and continue in a downward direction. Traders can use these levels to identify potential trade entries or exits, as well as to set stop-loss and take-profit levels.
Overall, the Fractal ROC , ATR Break, and Order Blocks indicator is a powerful tool for traders who want to identify potential trade opportunities and manage risk. By combining these three concepts, traders can gain a deeper understanding of market dynamics and make more informed trading decisions. As with any indicator, it is important to use it in conjunction with other analysis tools and to have a clear trading plan in place.

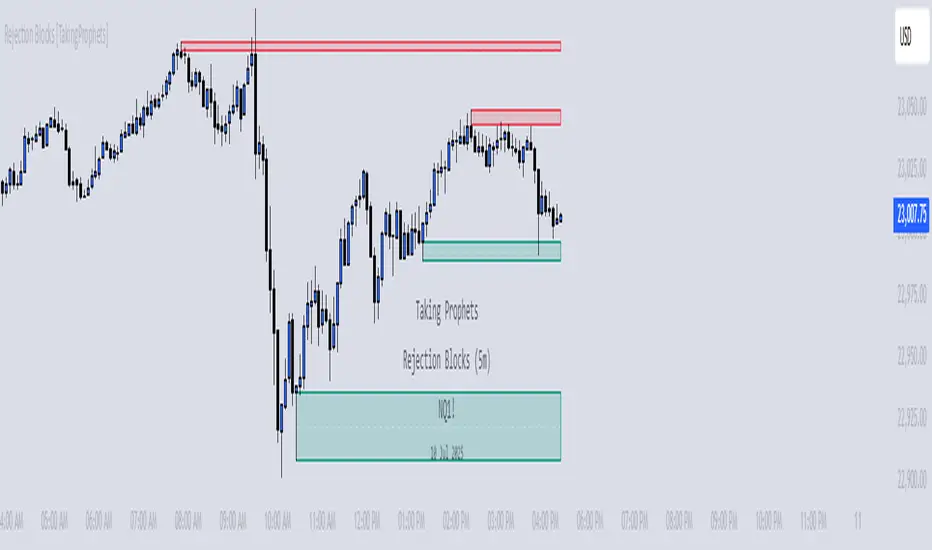
Rejection Blocks [Taking Prophets]🧠 Indicator Purpose:
The "Rejection Blocks" indicator is built for traders using Inner Circle Trader (ICT) concepts. It identifies key reversal zones where price action shows strong rejection through wick-dominant behavior around major swing points — often signaling institutional activity. Traders can use these rejection blocks to anticipate future support, resistance, and mitigation zones based on ICT principles.
🌟 What Makes This Indicator Unique:
Unlike standard support/resistance indicators, this script detects true rejection points by filtering only candles where the wick is significantly larger than the body, confirming potential order flow shifts according to ICT methodology.
It not only marks these zones but also:
Dynamically extends the blocks into the future.
Deletes blocks that get invalidated (mitigation logic).
Optionally plots a 50% midline within each block to refine entry or exit precision.
⚙️ How the Indicator Works:
Swing Detection: Identifies significant highs and lows based on pivot structures.
Rejection Filtering: Confirms strong rejections with wick-to-body ratio validation.
Block Creation: Highlights bullish or bearish rejection zones with customizable visuals.
Midline Plotting: (Optional) Marks the 50% midpoint of the block for entry targeting.
Mitigation and Cleanup: Blocks are deleted automatically when their structure is invalidated, maintaining a clean and accurate chart view.
🎯 How to Use It:
Identify Reaction Zones: Use rejection blocks as potential areas for price reversals or consolidations.
Plan Trade Entries: Monitor retests of the block boundaries or 50% lines for precision entries.
Manage Risk: If price closes beyond the block, treat it as a potential invalidation or Change in State of Delivery (CISD) event.
Best Contexts:
Near higher timeframe Points of Interest (POIs) such as Order Blocks or Fair Value Gaps.
During ICT Killzones (London Open, New York AM).
🔎 Underlying Concepts:
Wick Rejections: Indicate strong liquidity rejection, aligning with ICT liquidity sweep theories.
Mitigation Behavior: Blocks often serve as revisit zones where price rebalances after an aggressive move.
Adaptive Market Behavior: Rejection Blocks adjust dynamically based on real-time price action according to ICT market structure logic.
🎨 Customization Options:
Bullish and Bearish block colors with adjustable opacity.
Border visibility, border width, and 50% midline display toggles.
Label size customization for optimal chart clarity.
✅ Recommended for:
Traders following Inner Circle Trader (ICT) concepts.
Scalpers, intraday, and swing traders seeking accurate reversal and mitigation zones.
Traders looking to improve precision around liquidity rejection events.
Multi Indicator SummaryPurpose: It calculates and displays bullish and bearish order blocks, key levels derived from recent price movements, which traders use to identify potential support and resistance areas.
Inputs: Users can customize the order block length, defining the range of price data used for calculations.
Logic: The script uses ta.lowest and ta.highest functions to compute order blocks based on specified periods for bullish and bearish trends.
Additional Levels: It identifies extra order blocks (bullish_below and bearish_above) to provide more context for deeper support or higher resistance.
Price Table: A visual table is created on the chart, showing the current price, bullish and bearish order blocks, and additional bearish levels above the current price.
Alerts: Alerts are triggered when the price crosses key order block levels, helping traders react to significant price movements.
Flexibility: The table dynamically updates based on the chart’s ticker and timeframe, ensuring it always reflects the latest data.
Bearish Above Price: Highlights the most recent bearish order block above the current price to inform traders about potential resistance areas.
Visualization: The clear table format aids quick decision-making by summarizing key levels in an accessible way.
Usability: This script is especially useful for intraday and swing traders seeking to integrate order block analysis into their strategies.

16. SMC Strategy with SL - low TimeframeOverview
The "SMC Strategy with SL - low Timeframe" is a comprehensive trading strategy that uses key concepts from Smart Money Theory to identify favorable areas in the market for buying or selling. This strategy takes advantage of price imbalances, support and resistance zones, and swing highs/lows to generate high-probability trade signals.
The key features of this strategy include:
Swing High/Low Analysis: Used to determine the Premium, Equilibrium, and Discount Zones.
Order Block Integration: An added layer of confluence to identify valid buy and sell signals.
Trend Direction Confirmation: Using a Simple Moving Average (SMA) to determine the overall trend.
Entry and Exit Rules: Based on price position relative to key zones and moving average, along with optional stop-loss and take-profit levels.
Detailed Description
Swing High and Swing Low Analysis
The script calculates Swing High and Swing Low based on the most recent price highs and lows over a specified look-back period (swingHighLength and swingLowLength, set to 8 by default).
It then derives the Premium, Equilibrium, and Discount Zones:
Premium Zone: Represents potential resistance, calculated based on recent swing highs.
Discount Zone: Represents potential support, calculated based on recent swing lows.
Equilibrium: The midpoint between Swing High and Swing Low, dividing the price range into Premium (above equilibrium) and Discount (below equilibrium) areas.
Zone Visualization
The strategy plots the Premium Zone (resistance) in red, the Discount Zone (support) in green, and the Equilibrium level in blue on the chart. This helps visually assess the current price relative to these important areas.
Simple Moving Average (SMA)
A 50-period Simple Moving Average (SMA) is added to help identify the trend direction.
Buy signals are valid only if the price is above the SMA, indicating an uptrend.
Sell signals are valid only if the price is below the SMA, indicating a downtrend.
Entry Rules
The script generates buy or sell signals when certain conditions are met:
A buy signal is triggered when:
Price is below the Equilibrium and within the Discount Zone.
Price is above the SMA.
The buy signal is further confirmed by the presence of an Order Block (recent lowest price area).
A sell signal is triggered when:
Price is above the Equilibrium and within the Premium Zone.
Price is below the SMA.
The sell signal is further confirmed by the presence of an Order Block (recent highest price area).
Order Block
The strategy defines Order Blocks as recent highs and lows within a look-back period (orderBlockLength set to 20 by default).
These blocks represent areas where large players (smart money) have historically been active, increasing the probability of the price reacting in these areas again.
Trade Management and Trade Direction
The user can set Trade Direction to either "Long Only," "Short Only," or "Both." This allows the strategy to adapt based on market conditions or trading preferences.
Based on the Trade Direction, the strategy either:
Closes open trades that are against new signals.
Allows only specific directional trades (either long or short).
Stop-loss levels are defined based on a fixed percentage (stop_loss_percent), which helps to manage risk and minimize losses.
Exit Rules
The strategy uses stop-loss levels for risk management.
A stop-loss price is set at a fixed percentage below the entry price for long positions or above the entry price for short positions.
When the price hits the defined stop-loss level, the trade is closed.
Liquidity Zones
The script identifies recent Swing Highs and Lows as potential liquidity zones. These are levels where price could react strongly, as they represent areas of interest for large traders.
The liquidity zones are plotted as crosses on the chart, marking areas where price may encounter significant buying or selling pressure.
Visual Feedback
The script uses visual markers (green for buy signals and red for sell signals) to indicate potential entries on the chart.
It also plots liquidity zones to help traders identify areas where stop hunts and liquidity grabs might occur.
Monthly Performance Dashboard
The script includes a performance tracking feature that displays monthly profit and loss metrics on the chart.
This dashboard allows the trader to see a visual representation of trading performance over time, providing insights into profitability and consistency.
The table shows profit or loss for each month and year, allowing the user to track the overall success of the strategy.
Key Benefits
Smart Money Concepts (SMC): This strategy incorporates SMC principles like order blocks and liquidity zones, which are used by institutional traders to determine potential market moves.
Zone Analysis: The use of Premium, Discount, and Equilibrium zones provides a solid framework for determining where to enter and exit trades based on price discounts or premiums.
Confluence: Signals are not taken in isolation. They are confirmed by factors like trend direction (SMA) and order blocks, providing greater trade accuracy.
Risk Management: By integrating stop-loss functionality, traders can manage their risks effectively.
Visual Performance Metrics: The monthly and yearly performance dashboard gives valuable feedback on how well the strategy has performed historically.
Practical Use
Buy in Discount Zone: Traders would be looking to buy when the price is discounted relative to its recent range and is above the SMA, indicating an overall uptrend.
Sell in Premium Zone: Conversely, traders would be looking to sell when the price is at a premium relative to its recent range and below the SMA, indicating an overall downtrend.
Order Block Confirmation: Ensures that buying or selling is supported by historical price behavior at significant levels, providing confidence that the market is likely to react at these areas.
This strategy is designed to help traders take advantage of price inefficiencies and areas where institutional traders are likely to be active, increasing the odds of successful trades. By leveraging Smart Money concepts and strong technical confluence, it aims to provide high-probability trade setups.

BigBeluga - Smart Money ConceptsSmart Money Concepts (SMC) is a comprehensive toolkit built around the around the principles of "smart money" behavior, which refers to the actions and strategies of institutional investors.
SMC transcends traditional technical analysis by delving deeper into this framework. This approach allows users to decipher the actions of these influential players, anticipate their potential impact on market dynamics, and gain insights beyond just price movements.
This all-in-one toolkit provide the user with a unique experience by automating most of the basic and advanced concepts on the chart, saving them time and improving their trading ideas.
🔹Real-time market structure analysis simplifies complex trends by pinpointing key support, resistance, and breakout levels.
🔹Advanced order block analysis leverages detailed volume data to pinpoint high-demand zones, revealing internal market sentiment and predicting potential reversals. This analysis utilizes bid/ask zones to provide supply/demand insights, empowering informed trading decisions.
🔹Imbalance Concepts (FVG and Breakers) allows traders to identify potential market weaknesses and areas where price might be attracted to fill the gap, creating opportunities for entry and exit
🔹Swing failure patterns help traders identify potential entry points and rejection zones based on price swings
🔹Liquidity Concepts, our advanced liquidity algorithm, pinpoints high-impact events, allowing you to predict market shifts, strong price reactions, and potential stop-loss hunting zones. This gives traders an edger to make informed trading decisions based on multi-timeframe liquidity dynamics
🔶 FEATURES
The indicator has quite a lot of features that are provided below:
Swing market structure
Internal market structure
Mapping structure
Discount/Premium zone
Adjustable market structure
Strong/Weak H&L
Sweep
Volumetric Order block / Breakers
Fair Value Gaps / Breakers (multi-timeframe)
Swing Failure Patterns (multi-timeframe)
Deviation area
Equal H&L
Liquidity Prints
Buyside & Sellside
Sweep Area
Highs and Lows (multi-timeframe)
🔶 BASIC DEMONSTRATION
The preceding image illustrates the market structure functionality within the Smart Money Concepts indicator.
Solid lines: These represent the core indicator's internal structure, forming the foundation for most other components. They visually depict the overall market direction and identify major reversal points marked by significant price movements (denoted as 'x').
Dotted lines: These represent an alternative internal structure with the potential to drive more rapid market shifts. This is particularly relevant when a significant gap exists in the established swing structure, specifically between the Break of Structure (BOS) and the most recent Change of High/Low (CHoCH). Identifying these formations can offer opportunities for quicker entries and potential short-term reversals.
Sweeps (x): These signify potential turning points in the market where liquidity is removed from the structure. This suggests a possible trend reversal and presents crucial entry opportunities. Sweeps are identified within both swing and internal structures, providing valuable insights for informed trading decisions.
🔶 USAGE & EXAMPLES
The image above showcases a detailed example of several features from our toolkit that can be used in conjunction for a comprehensive analysis.
Price rejecting from the bullish order block (POC), while printing inside a bullish SFP and internal structure turning bullish (Internal CHoCH).
The image further demonstrates how two bearish order blocks could potentially act as resistance zones when prices approach those levels. These areas might also offer attractive locations to place take-profit orders.
The price has reached our first take-profit level, but is exhibiting some signs of weakness, suggesting a potential pullback which could put the trade at higher risk.
On the other hand, the price action currently exhibits strong bullish sentiment, suggesting favorable entry points and a potential upward trend.
The price has now fully reached our take-profit zone and is also exhibiting bearish confluence, indicating a potential price reversal or trend shift.
🔶 USING CONFLUENCE
The core principle behind the success of this toolkit lies in identifying "confluence." This refers to the convergence of multiple trading indicators all signaling the same information at a specific point or area. By seeking such alignment, traders can significantly enhance the likelihood of successful trades.
In the image above we can see a few examples of the indicator used in confluence with other metrics included in the toolkit.
Liquidity Prints within order blocks
SFP close to the POC
Sweep in liquidity close to a fair value gaps
These are just a few examples of what applying confluence can look like.
🔶 SETTINGS
Window: limit calculation period
Swing: limit drawing function
Internal: a period of the beginning of the internal structure
Mapping structure: show structural points
Algorithmic Logic: (Extreme-Adjusted) Use max high/low or pivot point calculation
Algorithmic loopback: pivot point look back
Premium / Discount: Lookback period of the pivot point calculation
Show Last: Amount of Order block to display
Hide Overlap: hide overlapping order blocks
Construction: Size of the order blocks
Fair value gaps: Choose between normal FVG or Breaker FVG
Mitigation: (close - wick- avg) point to mitigate the order block/imbalance
SFP lookback: find a higher / lower point to improve accuracy
Threshold: remove less relevant SFP
Equal h&L: (short-mid-long term) display longer term
Any Alert(): Trigger alerts based on the selected inputs

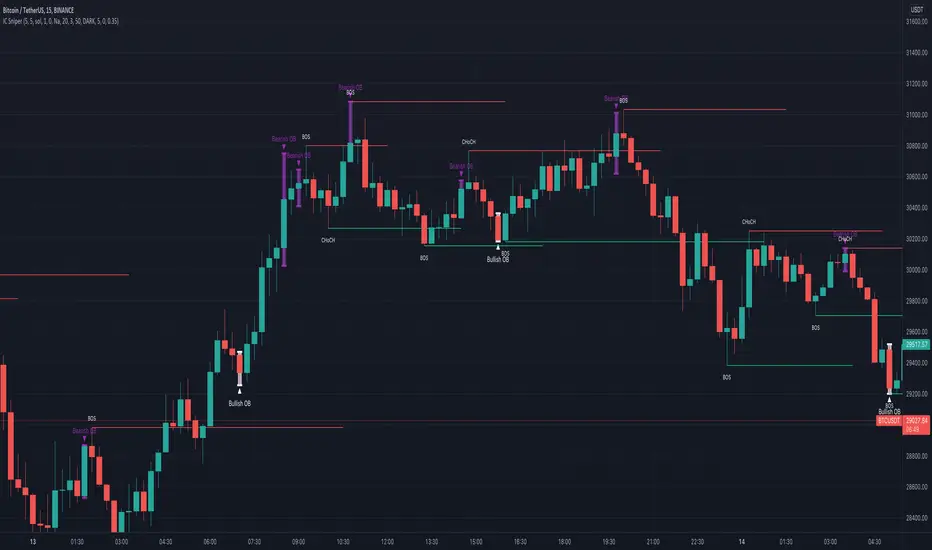
IC Sniper
Hello fellow traders,
This is a script which tries to visualise SMC /Institutional Candles.
Few of the features which are used in the script are explained below,
CAUTION, Do not enable IC Candles option (BETA). It has a lot of flaws which require solving the problem from a different angle, and I am trying my level best to figure out a solution.
Left Bars and Right Bars, used to find pivot high and lows to help us make Market Structure.
Now first thing to understand when trying to figure out SMC or institutional moves is the figure out the trend you are in. Trend is always your friend, so use higher time frame to just see the trend ( Trend lines are handy ).
I suggest using manual trend detection option, you have other two options available. Either of them have some flaws which can be worked upon if required.
Find the trend, be it manually or EMA ensures are trend support order blocks and engulfing candles are shown.
IC = Institutional Candle
How to find an IC ???
Simple things are ensured.
Below is defined for a bear market
1) Clears liquidity ( I simply see the last green candle before a minor dump ( vice-versa ) and see if the last green candle or the following red candle have huge wicks which clear recent previous highs (3 candles)
2) Next I see if the red candle after the last green candles is engulfing in nature ( yellow for bearing environment and white for bullish )
3) Then I create an order block.
4) Sometimes if imbalance after an order block is tooo big, the re test only fills the imbalance rather than reaching the IC . Imbalances are shown with grey boxes, the ones filled are automatically removed.
For successful entries please ensure that the candles succeeding engulfing candles break a market structure (BOS, ChoCh).
Any suggestion are welcome.
Please change max moves to detect to 5 from 3
Caution not all order blocks made are perfect !! Further adjustments are required but are too complicated for me to code, have to find some way around and I am sure with update I will refine the options.
Basic things to look,
IC should be followed buy a pump or a dump ( with some candles being out of the trend (I have given some scope in the code)) plus it should have a high wick which clears liquidity.
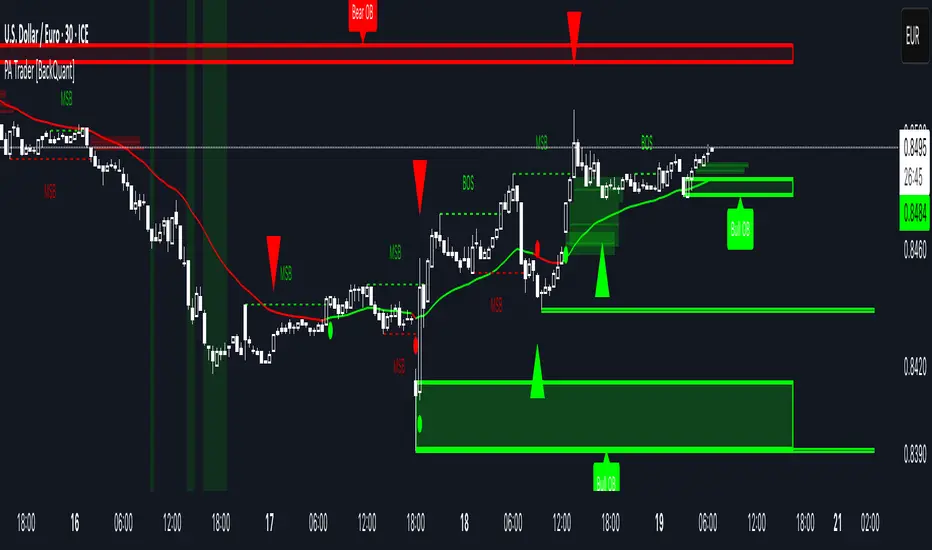
Price Action Trader [BackQuant]Price Action Trader
Introduction
Price Action Trader is an all-in-one, chart-side workflow for reading trend, timing impulses, and mapping high-probability zones the way discretionary traders actually trade. It blends an ensemble trend engine with clean price-action building blocks—Market Structure (BOS/MSB), Fair Value Gaps, Order Blocks, and Volumetric Support/Resistance—so you can form a bias, find confluence, and execute with context.
What is it
A modular “price-action stack” that:
Paints trend bias and impulse shifts on the chart (optional candle coloring).
Auto-annotates internal & swing structure (BOS / MSB).
Finds FVGs on your chosen timeframe and draws them cleanly.
Detects Order Blocks (with optional FVG confirmation).
Builds volumetric S/R levels that adapt to liquidity.
Emits alerts for key events (new levels, touches, breaks, OB creation/touch).
Everything is configurable—keep it minimal (trend + a few zones) or run the full toolkit.
What’s it used for
Bias first, trade second: establish direction/conviction, then execute where structure, gaps, blocks, and volume agree.
Timing: impulse flips and level touches provide actionable triggers.
Risk placement: OB edges, FVG midlines, and volumetric bands give logical stop/target references.
Review & journaling: optional session shading and labeled structures make post-trade notes simple.
Composite Trend Model
A lightweight signal line (default: 30-period) that turns green when the composite regime is bullish and red when bearish. Under the hood, multiple cues (adaptive momentum, de-noised oscillation, volatility-aware filters) are blended into a single directional score; when thresholds flip, the line recolors and optional Long/Short dots appear.
How to use
Treat the line as your bias rail : favor longs while green, shorts while red.
Flat/rapid flips = stand down or reduce size.
Prefer clean charts? Keep only the line and (optionally) trend-painted candles.
Inputs to know
Show Trend Signal Line / Width.
Paint Candles by Trend.
Long/Bearish color controls.
Impulse Model
Highlights short-term pressure shifts with optional impulse candle coloring and ▲/▼ markers. Great for entries in the prevailing trend and for early warnings when impulses fire against bias.
How to use
Up-bias: look for the next impulse-up near structure/FVG/OB or volumetric support.
Down-bias: mirror the logic.
Frequent counter-impulses → expect chop or regime change.
Inputs to know
Show Impulse Signals.
Paint Impulse Candles.
Market Structure
Automatic Internal (tight lookback) and Swing (wider lookback) structure with BOS and MSB (CHoCH) labels. You decide what to show—All, BOS only, MSB only—independently for internal vs swing.
How to use
Use Swing labels for the primary map; Internal for entry refinement.
After a bullish MSB , seek the first HL back into support/FVG/OB.
After a bearish BOS , favor LH fades into resistance/FVG/OB.
Inputs to know
Swing Lookback / Internal Lookback.
Swing/Internal Structure: All | BOS | MSB | None .
Separate bull/bear color controls for both layers.
Fair Value Gaps
Detects bullish/bearish FVGs on the current or higher TF, draws boxes, and can extend them forward. Midlines provide quick visual targeting.
How to use
In-trend fills: in an up-bias, tags of bullish FVGs often offer high-quality continuation entries, especially with structure/OB confluence.
Failed fills: rejections at the midline can signal emerging strength/weakness.
Inputs to know
Show FVG / Show Last N / Extend.
Timeframe (blank = chart TF; set higher TF for macro FVGs).
Bull/Bear colors (tune opacity to taste).
Volumetric Support and Resistance
Builds adaptive S/R from price interaction + relative volume over a rolling lookback. Levels store touch counts; you can show volume stats on labels or inside boxes. Transparency and border thickness can scale with volume so stronger levels are visually louder. Broken levels can auto-remove.
How to use
Use as confluence with structure, OBs, and FVGs. A long at volumetric support + Bull OB + FVG midline is qualitatively different from a naked level.
If a level breaks on strong volume, stop fading—flip expectations or wait for a clean retest.
Inputs to know
Detection Sensitivity / Volume Multiplier.
Analysis Period / Max Levels / Min Distance (%).
Remove Broken / Extend Right / Show Volume Info / Text Inside.
Support/Resistance colors (+ high-vol variants).
Alerts
New Support/Resistance Level Created.
Level Touch.
Level Break.
Order Blocks
Detects bullish/bearish OBs using configurable fractals (3- or 5-bar) with a break confirmation (by Close or High/Low). Optional FVG proximity filter, right-extension, and auto-delete when filled.
How to use
Bullish bias: stalk pullbacks into fresh Bull OBs aligned with a bullish FVG or volumetric support.
If price fills an opposing OB and fails to continue, reassess bias—context may be shifting.
Inputs to know
Fractal Type & Break Method (Close / HL).
Filter with FVG + Max FVG Distance.
Extend Blocks / Delete When Filled / Show Labels.
Alerts
New Order Block Created.
Order Block Touch.
Final Notes
Suggested workflow
Start with Composite Trend (bias).
Mark Swing structure in that direction.
Wait for an Impulse in-direction near an OB / FVG / Volumetric level.
Risk = nearest opposite level or OB edge; targets = FVG midlines / next S/R.
Timeframes & assets
Defaults suit liquid intraday and 1–4H swing.
Slower markets → lengthen lookbacks, lower sensitivity.
Very noisy crypto → keep trend visible, trim drawings (e.g., MSB only, last 3–5 FVGs, 8–12 volume levels).
Keep it readable
Turn off modules you don’t need today—fewer, higher-quality signals beat clutter.
About this release
Internal scoring, smoothing, and detection logic are proprietary. Behavior is controlled via inputs described above.
Trade with a plan, test your settings, and let confluence do the heavy lifting.
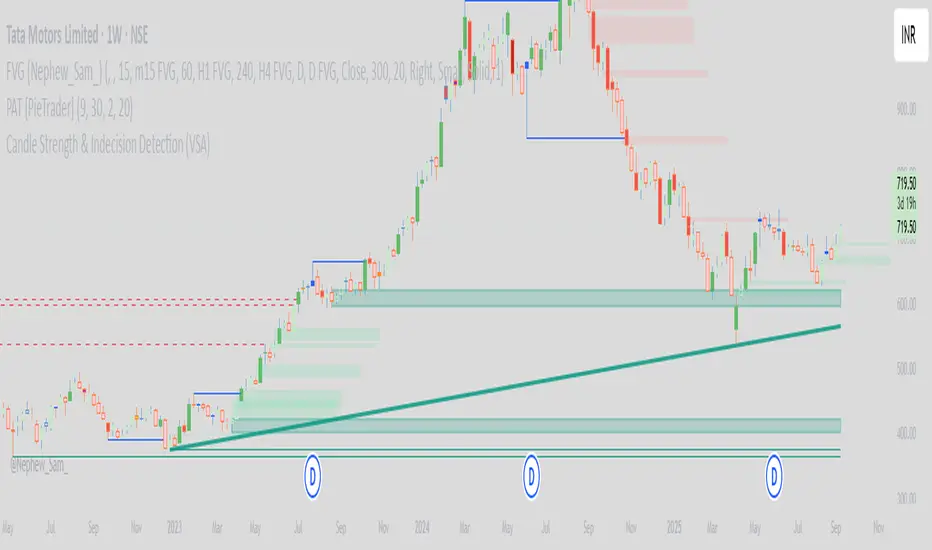
PAT [PieTrader]This Pine Script (//@version=6) is an advanced Price Action Toolkit (PAT) – PieTrader, enhanced by the PieTrader community to combine core Smart Money Concepts into one visual framework. It integrates market structure, liquidity sweeps, order blocks, and dynamic trendlines, with customizable settings for flexibility.
Market Structure (Zigzag): The script tracks trend shifts using a configurable zigzag length. Swing highs and lows are recorded, and optional zigzag lines visualise price movement. Structure shifts are highlighted with Change of Character (CHoCH) or Break of Structure (BoS) labels, providing clear signals of directional intent.
Order Blocks: On detecting structure breaks, bullish and bearish order blocks are marked with ATR-based zones. These are drawn as shaded boxes, with user control over how many remain visible. Invalid or broken blocks are automatically removed to keep the chart clean.
Liquidity Sweeps: Pivot highs and lows over a chosen lookback define liquidity levels. These are shown as horizontal lines that switch to dashed style once swept by price. Markers (“x”) identify sweep points, helping traders spot liquidity grabs. To optimise performance, older levels are deleted beyond a fixed storage limit.
Trendlines: Using pivot detection, the system identifies bullish and bearish trendlines. Valid lines with upward or downward slopes are extended in real time, updating dynamically with price. Bullish lines are teal; bearish lines are red.
Additional Features: A watermark option displays “PieTrader” on the chart, and colour themes are fully customizable.
In summary, the PieTrader community’s enhancements make this toolkit a comprehensive visual aid for analysing market structure, liquidity, and trend alignment within a streamlined charting solution.
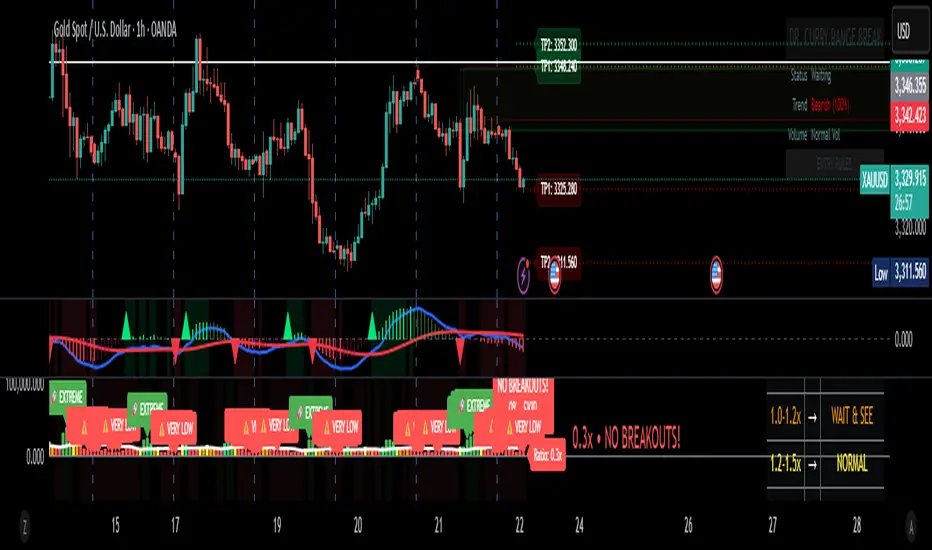
Dr. Curry Range Break# 🚀 DR. CURRY RANGE BREAK - QUICK START CHEAT SHEET
## ⚡ 5-MINUTE SETUP GUIDE
### 1️⃣ **ADD TO CHART**
- Timeframe: **5-MINUTE CHART** (MUST USE!)
- Add indicator: "Dr. Curry Range Break"
- Default settings work great!
### 2️⃣ **WAIT FOR THE BLUE BOX** (9:30-9:45 AM ET)
```
🔵 BLUE BOX = Your Trading Range
- Forms in first 15 minutes
- DO NOT TRADE until box completes!
```
### 3️⃣ **WATCH FOR BREAKOUT SIGNALS**
#### 🟢 **LONG SETUP (BUY)**
- Price CLOSES above blue box
- Look for signal on chart:
- **GREEN = GO!** (★★★ Best)
- **BLUE = GOOD** (★★)
- **GOLD = CAREFUL** (★)
#### 🔴 **SHORT SETUP (SELL)**
- Price CLOSES below blue box
- Look for signal on chart:
- **RED = GO!** (★★★ Best)
- **BLUE = GOOD** (★★)
- **GOLD = CAREFUL** (★)
## 📊 TRADE MANAGEMENT
### **ENTRY CHECKLIST** ✅
1. Blue box complete? ✓
2. Candle CLOSED outside box? ✓
3. Signal appeared? ✓
4. Volume says "HIGH VOL"? (Even better!)
### **WHERE TO EXIT**
- **Take Profit**: Green/Red TP lines on chart
- **Stop Loss**: Opposite side of blue box
- **Quick Rule**: Risk $100 to make $200+
## 🎯 THE ONLY 3 RULES YOU NEED
### RULE 1: **COLOR = ACTION**
```
GREEN/RED Candle = BEST Trade
BLUE Candle = GOOD Trade
GOLD Candle = SKIP (risky)
```
### RULE 2: **STARS = QUALITY**
```
★★★ = Full position size
★★ = Half position size
★ = Don't trade (or tiny size)
```
### RULE 3: **PANEL = CONFIRMATION**
Look for:
- **"HIGH VOL ✓"** = Strong move
- **"Bullish/Bearish"** = With trend
- **Stop Loss price** = Your exit
## 🚦 SIMPLE DECISION TREE
```
Is there a BLUE BOX?
↓ NO → Wait
↓ YES
Did price CLOSE outside box?
↓ NO → Wait
↓ YES
What COLOR is the signal?
↓ GOLD → Skip trade
↓ BLUE → Maybe trade (check stars)
↓ GREEN/RED → TRADE IT!
```
## ⏰ BEST TRADING TIMES
**BEST**: 9:45 AM - 10:30 AM ET
**GOOD**: 10:30 AM - 11:30 AM ET
**AVOID**: After 12:00 PM (lunch chop)
## 💰 POSITION SIZING (Beginners)
- **★★★ Signal**: Risk 1% of account
- **★★ Signal**: Risk 0.5% of account
- **★ Signal**: Don't trade
**Example**: $10,000 account
- ★★★ = Risk $100 per trade
- ★★ = Risk $50 per trade
## 🛑 STOP DOING THIS
❌ Trading before blue box completes
❌ Entering on wick touches (need CLOSE)
❌ Taking ★ trades
❌ Moving your stop loss
❌ Revenge trading after a loss
## ✅ START DOING THIS
✅ Wait for box completion
✅ Only trade ★★ or ★★★
✅ Use the stop loss shown
✅ Take partial profits at TP1
✅ Stop after 2 losses
## 📱 FIRST WEEK GOALS
- **Monday**: Just watch, don't trade
- **Tuesday**: Paper trade only ★★★ signals
- **Wednesday**: Paper trade ★★★ and ★★
- **Thursday**: Small real trades (★★★ only)
- **Friday**: Review and learn
## 🎪 THE "SET IT AND FORGET IT" METHOD
1. **Entry**: Market order on signal
2. **Stop**: Set at opposite box level
3. **Target**: Set at TP1 (first green/red line)
4. **Walk away**: Let it hit stop or target
## 🚨 EMERGENCY RULES
**STOP TRADING IF**:
- Lost 2 trades today
- Feeling emotional
- No clear signals appearing
- Market is choppy (no trend)
---
## 📝 YOUR DAILY ROUTINE
**9:25 AM**: Chart open, indicator on
**9:30 AM**: Watch blue box form
**9:45 AM**: Box complete, watch for breakout
**9:46 AM+**: Take signal if it appears
**10:30 AM**: Review trades, possibly done for day
## 💡 ONE LAST TIP
**Start with SIM/Paper Trading for 1 week minimum!**
The best traders are patient traders. Wait for YOUR setup - the market will always give you another chance tomorrow.
**Remember**: 1 good ★★★ trade > 5 random trades
Good luck! 🍀# Dr. Curry Range Break - Professional Trading Indicator
## Overview
The **Dr. Curry Range Break** is a comprehensive trading system designed to identify high-probability breakout opportunities during the market's opening range period. This professional-grade indicator combines volume analysis, multi-timeframe trend confirmation, and smart money concepts to give traders a complete edge in range breakout trading.
## 🎯 Key Features
### 1. **Opening Range Detection**
- Automatically identifies and marks the opening range (5, 15, or 30-minute options)
- Clear visual box showing the range high and low
- Professional blue color scheme for easy identification
### 2. **Smart Breakout Signals**
- **GREEN CANDLE + "STRONG BUY ★★★"** = High probability setup (with trend + high volume)
- **BLUE CANDLE + "BUY SIGNAL ★★"** = Good setup (with trend, normal volume)
- **GOLD CANDLE + "RISKY BUY ★"** = Caution (against trend)
### 3. **Automatic Target Levels**
- Displays TP1, TP2, TP3 levels based on previous swing points
- Clear price labels showing exact target levels
- Green lines for long targets, red lines for short targets
### 4. **Multi-Timeframe Trend Analysis**
- Analyzes 15m, 60m, and 240m timeframes simultaneously
- Shows trend strength percentage in the panel
- Confirms if your trade aligns with the bigger picture
### 5. **Volume Confirmation**
- Identifies high-volume breakouts automatically
- "HIGH VOL ✓" indicator in panel when volume exceeds threshold
- Helps filter out false breakouts
### 6. **Advanced Features**
- Fair Value Gaps (FVG) detection
- Order Block identification
- Stop loss levels clearly marked
- Professional trading panel with all key information
## 📖 How to Use
### Setup
1. **Best Timeframe**: Use on 5-minute chart (also works on 1m and 15m)
2. **Market Open**: Indicator activates at 9:30 AM ET (configurable)
3. **Range Duration**: Default 15 minutes (9:30-9:45 AM)
### Entry Rules
1. **Wait for Range Lock**: Let the opening range complete (default 15 minutes)
2. **Watch for Breakout**: Price must CLOSE above/below the range
3. **Check the Signal**:
- ★★★ = Take the trade with confidence
- ★★ = Good setup, normal position size
- ★ = Risky, reduce size or skip
### Exit Strategy
- **Take Profit**: Use the TP levels shown on chart
- **Stop Loss**: Opposite side of the range (shown in panel)
- **Trail Stop**: Move to breakeven after TP1
## 🔍 What to Look For
### Best Setups (★★★)
- Green/Red candle on breakout
- "HIGH VOL ✓" in panel
- Trend aligned (Bullish/Bearish in panel)
- Clear TP levels above/below
### Good Setups (★★)
- Blue candle on breakout
- Normal volume
- With trend direction
- Multiple TP levels available
### Avoid These (★)
- Gold/Yellow candle (against trend)
- Low volume breakouts
- Choppy market conditions
- No clear TP levels
## ⚙️ Customization Options
### Visual Settings
- **Minimal Mode**: Reduces clutter for experienced traders
- **Show/Hide**: Targets, FVG, Order Blocks, Swing Points
- **Panel Position**: Choose corner placement
### Range Settings
- **Timezone**: Adjust for your market
- **Duration**: 5, 15, or 30-minute ranges
- **Market Open**: Customize start time
### Advanced Settings
- **Volume Multiplier**: Adjust high volume threshold
- **Target Count**: Show 1-3 TP levels
- **EMA Length**: Trend calculation period
## 💡 Pro Tips
1. **Best Days**: Monday-Thursday typically have cleaner breakouts
2. **Avoid Fridays**: Often choppy with less follow-through
3. **News Days**: Check economic calendar - avoid FOMC days
4. **Time It**: Best breakouts often occur 30-60 minutes after open
5. **Volume Matters**: Never take a ★ trade on low volume
## 🚨 Risk Management
- **Position Size**: Risk 1-2% per trade maximum
- **Stop Loss**: Always use the opposite range level
- **Scaling**: Take partial profits at each TP level
- **Daily Max**: Stop after 2-3 losses in a day
## 📊 Success Metrics
This indicator helps identify:
- High probability breakouts with 60-70% win rate on ★★★ setups
- Clear risk/reward with defined stops and targets
- Optimal entry timing with volume confirmation
- Trend alignment for higher probability trades
---
**Remember**: No indicator is perfect. Always use proper risk management and combine with your market knowledge. The Dr. Curry Range Break is a tool to enhance your decision-making, not replace it.
*Happy Trading! 📈*## 📦 Box Color Guide - Dr. Curry Range Break
### 🔵 **BLUE BOX - Opening Range**
- **What it means**: This is your main trading range (first 15/30 minutes)
- **How to use**: Wait for price to break above/below this box
- **Key levels**: Top = Range High (Long entry above), Bottom = Range Low (Short entry below)
### 🟢 **GREEN BOXES - Bullish Zones**
1. **Light Green Transparent Box (FVG - Fair Value Gap)**
- **What it means**: Bullish imbalance/gap in price
- **How to use**: Acts as support on pullbacks
- **Trading tip**: If price returns to this box after breakout, it's a good re-entry zone
2. **Very Light Green Box (Order Block)**
- **What it means**: Last bearish candle before a strong move up
- **How to use**: Major support zone
- **Trading tip**: Great area to add to positions or enter if missed initial breakout
### 🔴 **RED BOXES - Bearish Zones**
1. **Light Red Transparent Box (FVG - Fair Value Gap)**
- **What it means**: Bearish imbalance/gap in price
- **How to use**: Acts as resistance on pullbacks
- **Trading tip**: If price returns to this box after breakdown, it's a good re-entry zone for shorts
2. **Very Light Red Box (Order Block)**
- **What it means**: Last bullish candle before a strong move down
- **How to use**: Major resistance zone
- **Trading tip**: Great area to add to short positions or enter if missed initial breakdown
### 🟠 **ORANGE BOX - Breaker Block**
- **What it means**: Failed support/resistance that flipped
- **How to use**: Strong reversal zone
- **Trading tip**: Often marks the end of a move - consider taking profits
## 🎯 Quick Reference
```
BLUE = Your main range to trade
GREEN = Support zones (buy/hold)
RED = Resistance zones (sell/short)
ORANGE = Reversal warning
```
## 💡 Pro Tips for Using Boxes
1. **Multiple Green Boxes** = Stronger bullish bias
2. **Multiple Red Boxes** = Stronger bearish bias
3. **Price respecting boxes** = Higher probability trades
4. **Price ignoring boxes** = Potential trend change
### Box Stacking Priority
1. **Most Important**: Blue Opening Range
2. **Very Important**: Order Blocks (light green/red)
3. **Important**: FVG boxes
4. **Warning**: Orange breaker blocks
**Remember**: The more boxes align in one direction, the stronger the move typically is!
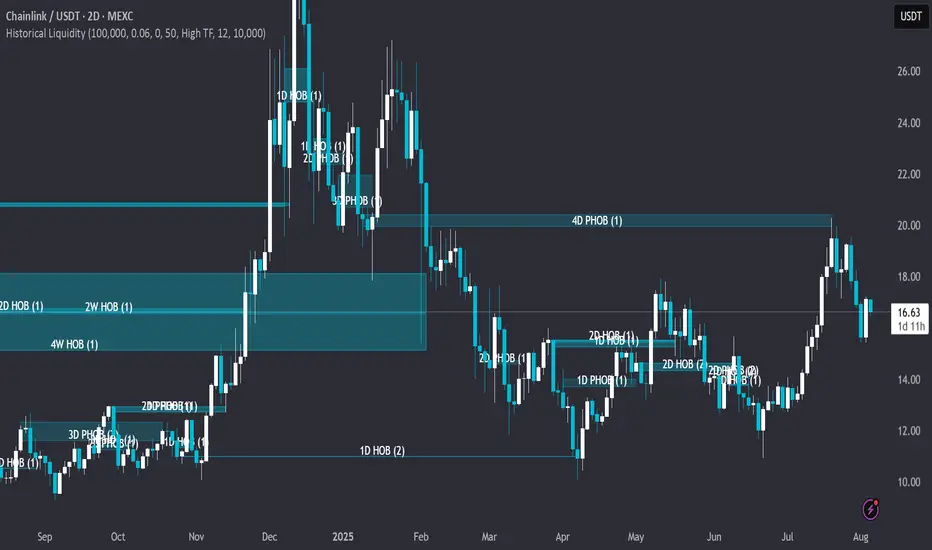
Historical LiquidityHistorical Liquidity Indicator – Backtesting Mitigated Hidden Order Blocks
🟠OVERVIEW: Historical Liquidity Indicator This script is a powerful backtesting tool and companion to our "Hidden Liquidity Indicator." It visualizes mitigated liquidity zones that have already been touched by price action. By showing a historical record of these events, it allows traders to systematically analyze past market structure, evaluate the effectiveness of liquidity zones, and refine their mitigation-based trading strategies.
🟠CORE LOGIC: The Connection to Hidden Liquidity The indicator's core logic is built upon the same proprietary methodology as our "Hidden Liquidity Indicator," which focuses on the relationship between Fair Value Gaps (FVGs) and candle bodies. The central idea is to identify institutional footprints—specifically, where hidden order blocks form—before the price revisits and "mitigates" them.
The process involves two main steps:
1. Detection of Liquidity Zones: The script identifies and classifies a liquidity zone based on specific, rule-based criteria:
o Hidden Order Block (HOB): A strong zone where a candle body fits 100% inside a Fair Value Gap, and is untouched by any wicks. For an HOB to be considered valid, its equilibrium (midpoint) must be crossed by the FVG.
o Partial Hidden Order Block (PHOB): A weaker, but still significant, zone where a candle body fits at least 50% inside the FVG.
2. Tracking Mitigation: The indicator then continuously tracks these detected zones. A zone is considered mitigated when a subsequent candle's wick or body touches or enters at least 50% of that zone.
Once a zone is detected and subsequently mitigated according to these rules, the indicator stores this information and visualizes it historically on the chart. This allows traders to see exactly where and how these hidden liquidity zones influenced past price action.
🟠SETTINGS & CUSTOMIZATION The indicator offers extensive customization to adapt to various trading styles and analysis needs.
• General & Candle Settings:
o Show Partial HOB: Toggle the visibility of Partial Hidden Order Blocks (PHOBs).
o Candle back count: Determines the number of historical bars to be analyzed.
o BB Deviation / BB Min Size Perc: These settings allow for fine-tuning the underlying volatility calculation, which helps in identifying the specific conditions for HOB formation.
o Partial Min Size in FVG Perc: Customizes the percentage (default 50%) required for a candle body to be considered a PHOB.
• Multi-Timeframe (MTF) Analysis: The indicator can check for liquidity zones on different timeframes. Users can select from pre-defined Low, Mid, or High Timeframe sets, or customize which specific timeframes are checked for analysis (e.g., 5m, 15m, 1h, 4h, 1D).
• Color & Visualization:
o HOBs and PHOBs: Users can customize the distinct colors for each type of liquidity zone.
o Box Border: Option to display or hide the border around the detected zones.
o Labels: Customize the color and text size of the labels describing each zone.
🟠PURPOSE & USAGE This indicator is specifically designed for systematic backtesting and strategic development. It is not intended to provide live trading signals. Its value lies in:
• Quantifying Success: It enables traders to measure the success rate of different HOB types across various timeframes and market conditions.
• Post-Mitigation Analysis: Users can analyze price behavior after a mitigation event, e.g., whether it led to continuation, reversal, or a retest.
• Identifying Support/Resistance: It helps to identify historical support and resistance levels that were formed by previously respected liquidity blocks, offering a data-driven alternative to traditional S/R methods.
🟠WHY IT MATTERS This indicator transforms subjective order block analysis into an objective, data-driven process. By providing a clear, visual history of which liquidity zones were actually respected or invalidated by the market, it empowers traders to build and validate their strategies on a foundation of empirical evidence rather than on intuition alone.
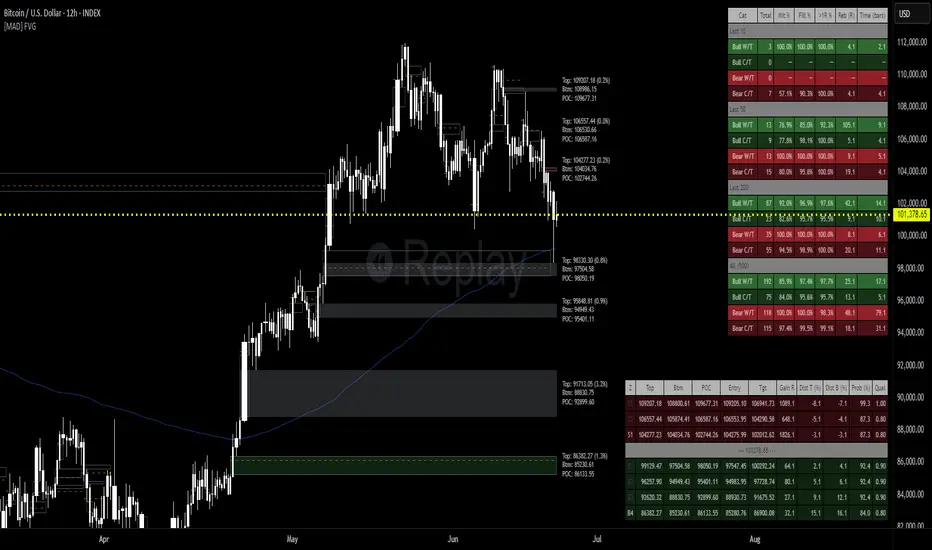
[MAD] FVG with LTF-POC/TPOOverview
The Fair Value Gap (FVG) Detector is a precision tool designed to automatically identify, draw, and track market inefficiencies. These gaps, also known as imbalances, often act as powerful magnets for future price action.
This indicator handles the entire lifecycle of an FVG: from its creation and extension, to the moment it is first touched, and through its entire mitigation process. To add an even deeper layer of analysis, it can now optionally plot two types of micro-analysis lines for the middle candle of the FVG pattern: a volume-based Point of Control (LTF-POC) and a time-based Time Price Opportunity (LTF-TPO). These high-precision lines pinpoint the most significant price levels within the imbalance itself.
By providing a clean and objective visualization of these critical price zones, the FVG Detector gives traders a clear framework for spotting high-probability setups and understanding how the market returns to areas of inefficiency to become balanced once again.
█ How It Works
The indicator’s logic is built on precise detection, dynamic visualization, and intelligent state tracking to provide a comprehensive view of market imbalances.
⚪ The FVG Detection Engine
At its core, the indicator uses a classic three-candle pattern to identify FVGs. This mechanical definition removes all subjectivity:
Bullish FVG: A gap is identified when the high of the first candle is lower than the low of the third candle. The space between these two prices creates the bullish FVG.
Bearish FVG: A gap is identified when the low of the first candle is higher than the high of the third candle. The space between these two prices creates the bearish FVG.
⚪ Dynamic Drawing and Mitigation
Once an FVG is detected, the indicator automatically draws a colored box to represent the gap. This box is then managed through its entire lifecycle:
Extension: If enabled, the FVG box extends forward in time with each new candle, acting as a visible, forward-looking zone of interest.
Partial Mitigation Trigger: The moment price first "touches" the gap, the box changes color to signal that it is no longer a fresh, unmitigated zone. The statistics table counts this as a "Partially Mitigated" event.
Shrinking FVG: As price moves further into the gap, the colored box dynamically shrinks, providing a real-time visual of how much of the imbalance has been filled.
Historical Outline: An optional secondary outline box is drawn to preserve the FVG's original size. This outline stops extending when the FVG is first touched, leaving a permanent historical marker.
⚪ Optional LTF Analysis for Added Precision
The indicator can look "inside" the FVG's middle candle to find its most significant price levels.
LTF-POC (Volume-Based): Using data from a lower timeframe, it analyzes the volume profile of the FVG-creating candle to find the single price level from the lower-timeframe bar with the highest trading volume.
LTF-TPO (Time-Based): It also identifies the Time Price Opportunity by dividing the candle's price range into distinct "bins." The script counts how many lower-timeframe price ticks occurred in each bin, and the TPO line is drawn at the center of the busiest bin.
Visual Confluence: These are drawn as distinct horizontal lines (defaulting to orange for POC and yellow for TPO) that extend and are managed alongside the FVG's historical outline, serving as precise levels of interest within the broader FVG zone.
█ Why This Indicator is Different
While many traders can spot FVGs manually, this indicator offers a significant edge through the possibility of the lowertimeframe analysis and showing the syntetic TPO or POCs for the relevant candles.
⚪ Automated and Objective
The market moves fast, and manually drawing FVGs is impractical and prone to error. This tool automates the entire process.
Never Miss a Gap: The detector impartially scans every three-candle sequence, ensuring no FVG is missed.
No Subjectivity: The rules for detection, mitigation, and LTF analysis are based on fixed mathematical models, removing subjective judgment.
Multi-Timeframe Clarity: The indicator works flawlessly on any timeframe, allowing you to maintain a consistent view of market structure.
⚪ Visualizing Market Memory
This tool does more than just draw boxes; it tells a story. Watching a box change color and shrink provides a visual of market dynamics in action. The optional historical outlines and LTF analysis lines build a "map" on your chart, showing where significant reactions and high-liquidity zones occurred in the past, which provides invaluable context for future price movements.
█ How to Use
⚪ Identifying High-Probability Zones
The primary use of the FVG Detector is to identify high-probability zones where price may react.
Entries: Unmitigated (fresh) FVGs can serve as powerful entry zones. Traders may look for price to return to a bullish FVG to take a long position, or to a bearish FVG to take a short position.
Targets: An FVG in your path can also act as a logical profit target. For example, if you are in a long position, you might take profit as price fills a nearby bearish FVG above you.
⚪ Confluence and Confirmation
FVGs are most powerful when they align with other forms of technical analysis. Look for FVGs that have "confluence" with:
Market Structure: A bullish FVG found at a key support level or after a bullish break of structure is a higher-probability setup.
Order Blocks: An FVG that overlaps with a bullish or bearish order block creates a very potent point of interest.
Premium/Discount Zones: FVGs found deep in a premium (for shorts) or discount (for longs) area of a trading range often yield strong reactions.
The LTF Lines (POC & TPO): Use these lines as a source of internal confluence. While the FVG gives you a zone, the POC and TPO give you precise levels within that zone. The POC shows where the highest volume was traded, while the TPO shows where price spent the most time. Confluence between these two lines can signal an extremely strong level.
█ Settings
Max Number of FVGs to Display: Controls how many active FVGs are kept on the chart to prevent clutter and maintain performance.
Extend Unmitigated FVGs: When enabled, FVG boxes will extend to the right until price touches them.
Show Bullish/Bearish FVGs: Toggles the visibility of bullish or bearish FVGs.
Show FVG Labels: Toggles the visibility of the "FVG" text labels.
Keep Mitigated Outlines: If checked, the historical outline box (and its associated POC/TPO lines) will remain on the chart even after the FVG is completely filled.
Show Statistics: Toggles the visibility of the statistics table, which tracks total, partly mitigated, and fully mitigated FVGs.
Show LTF-TPO (Time-Based): Toggles the calculation and display of the Time Price Opportunity line.
Show LTF-POC (Volume-Based): Toggles the calculation and display of the Point of Control line.
Use Custom LTF for Analysis: Check this to manually select a timeframe for the POC/TPO calculation. If unchecked, the script auto-selects a lower timeframe.
Lower Timeframe: The specific lower timeframe to use when the "Custom LTF" box is checked.
Magnifier (Bars per Slice): Controls how the script auto-selects a lower timeframe (higher number = lower timeframe). Only active when "Custom LTF" is unchecked.
█ The Logic Explained
This indicator uses a clear, rules-based system based on mathematical and conditional principles.
The 3-Candle FVG Pattern
The detection engine precisely identifies FVGs by comparing the price extremes of a three-candle sequence. For a bullish FVG, it confirms that the high of the first candle is strictly below the low of the third candle. For a bearish FVG, the low of the first candle must be strictly above the high of the third. This leaves an objective, unfilled gap in the market.
The Mitigation and Shrinking Process
Once an FVG is created, the indicator monitors it on every subsequent bar. The moment a candle's price action enters the FVG's zone, it's flagged as "partially mitigated," and its color changes. The script then continues to track how far price pushes into the gap, dynamically shrinking the box to visually represent the remaining imbalance.
Lower-Timeframe (LTF) Analysis Explained
To add precision, the indicator performs a micro-analysis of the middle candle of the FVG pattern. This is achieved by mathematically deconstructing that single candle using data from a smaller timeframe.
The lower timeframe is determined either manually or automatically via the Magnifier. The Magnifier works by dividing the chart's current timeframe. For example, on a 60-minute chart, a Magnifier of 60 tells the indicator to perform its analysis using 1-minute data (60÷60=1).
Once the LTF data is obtained, two calculations are performed:
LTF Point of Control (Volume-Based): This method seeks the price of maximum commitment. The indicator analyzes the volume of every single lower-timeframe bar within the main candle and identifies the one bar with the highest trading volume. The closing price of that specific high-volume bar is designated as the POC.
LTF Time Price Opportunity (Time-Based): This method finds the price where the market spent the most time trading. The process is a form of price distribution analysis:
The total price range (high to low) of the main candle is measured.
This range is divided into 40 equal price zones, or "bins". For a candle with a $2 range, each bin would represent a price slice of 5 cents
The indicator then counts how many of the lower-timeframe closing prices fall within each of the 40 bins.
The TPO line is drawn at the midpoint of the single bin that contained the most prices, representing the "busiest" price level.
Time-Based Drawing for Accuracy
To ensure perfect alignment across all historical data and chart reloads, all drawings are anchored to the precise timestamp of the bar, not its sequential position on the chart. This robust method guarantees that all zones remain fixed and accurate regardless of how much historical data is loaded.
█ Disclaimer
Investors are fully responsible for any investment decisions they make.
Have fun trading :-)
Enhanced London Session SMC SetupEnhanced London Session SMC Setup Indicator
This Pine Script-based indicator is designed for traders focusing on the London trading session, leveraging smart money concepts (SMC) to identify potential trading opportunities in the GBP/USD currency pair. The script uses multiple techniques such as Order Block Detection, Imbalance (Fair Value Gap) Analysis, Change of Character (CHoCH) detection, and Fibonacci retracement levels to aid in market structure analysis, providing a well-rounded approach to trade setups.
Features:
London Session Highlight:
The indicator visually marks the London trading session (from 08:00 AM to 04:00 PM UTC) on the chart using a blue background, signaling when the high-volume, high-impulse moves tend to occur, helping traders focus their analysis on this key session.
Order Block Detection:
Identifies significant impulse moves that may form order blocks (supply and demand zones). Order blocks are areas where institutions have executed large orders, often leading to price reversals or continuation. The indicator plots the high and low of these order blocks, providing key levels to monitor for potential entries.
Imbalance (Fair Value Gap) Detection:
Detects and highlights price imbalances or fair value gaps (FVG) where the market has moved too quickly, creating a gap in price action. These areas are often revisited by price, offering potential trade opportunities. The upper and lower bounds of the imbalance are visually marked for easy reference.
Change of Character (CHoCH) Detection:
This feature identifies potential trend reversals by detecting significant changes in market character. When the price action shifts from bullish to bearish or vice versa, a CHoCH signal is triggered, and the corresponding level is marked on the chart. This can help traders catch trend reversals at key levels.
Fibonacci Retracement Levels:
The script calculates and plots the key Fibonacci retracement levels (0.618 and 0.786 by default) based on the highest and lowest points over a user-defined swing lookback period. These levels are commonly used by traders to identify potential pullback zones where price may reverse or find support/resistance.
Directional Bias Based on Market Structure:
The indicator provides a market structure analysis by comparing the current highs and lows to the previous periods' highs and lows. This helps in identifying whether the market is in a bullish or bearish state, providing a clear directional bias for trade setups.
Alerts:
The indicator comes with built-in alert conditions to notify the trader when an order block, imbalance, CHoCH, or other significant price action event is detected, ensuring timely action can be taken.
Ideal Usage:
Timeframe: Suitable for intraday trading, particularly focusing on the London session (08:00 AM to 04:00 PM UTC).
Currency Pair: Specifically designed for GBP/USD but can be adapted to other pairs with similar market behavior.
Trading Strategy: Best used in conjunction with a price action strategy, focusing on the key levels identified (order blocks, FVG, CHoCH) and using Fibonacci retracement levels for precision entries.
Target Audience: Ideal for traders who follow smart money concepts (SMC) and are looking for a structured approach to identify high-probability setups during the London session.

Smart Money Concepts IndicatorBEST ICT AND SMC INDICATOR
The **Smart Money Concepts Indicator** is designed to enhance trading decisions by incorporating key principles from Smart Money Concepts (SMC), focusing on the detection of market structure changes, liquidity zones, order flow, and order blocks. This indicator is particularly useful for traders looking to understand market dynamics and make informed trading decisions based on advanced market analysis.
#### Key Features:
1. **Break of Structure (BOS)**:
- Identifies upward and downward breaks in market structure, indicating potential trend reversals.
- Visual markers on the chart help traders spot these critical levels.
2. **Change of Character (CHOCH)**:
- Detects significant changes in market direction, highlighting potential shifts in momentum.
- Clearly labeled signals indicate when the market may be changing its character.
3. **Order Blocks**:
- Highlights order blocks, which are key areas where significant buying or selling has occurred.
- Provides visual cues for potential support and resistance zones.
4. **Liquidity Zones**:
- Marks liquidity zones, indicating areas where buy-side or sell-side liquidity may be targeted.
- Helps traders understand where the market might draw liquidity.
5. **Dynamic Take Profit and Stop Loss Levels**:
- Calculates and plots take profit (TP) and stop loss (SL) levels based on the Average True Range (ATR) for adaptive risk management.
- Customizable multipliers allow traders to adjust levels based on their risk tolerance.
6. **Order Flow Analysis**:
- Displays bullish and bearish order flow signals based on candle close relative to open.
- Provides insights into market sentiment and potential future price action.
#### How to Use:
- **Identifying Entry and Exit Points**: Use BOS and CHOCH signals to find potential entry points, while leveraging TP and SL levels for risk management.
- **Market Analysis**: Analyze order blocks and liquidity zones to make informed decisions on market behavior.
- **Visual Confirmation**: The clear visual cues provided by the indicator make it easier to interpret market movements and align trades with institutional behavior.
#### Conclusion:
The Smart Money Concepts Indicator is an invaluable tool for traders looking to enhance their understanding of market structure and make more informed trading decisions. By integrating advanced concepts like BOS, CHOCH, and liquidity analysis, this indicator helps traders navigate the complexities of the market with greater confidence.

Price Action Toolkit Lite [UAlgo]The Price Action Toolkit Lite is a comprehensive indicator designed to enhance your chart analysis with advanced price action tools. This powerful toolkit combines multiple technical analysis concepts to provide traders with a clear visualization of market structure, liquidity levels, order blocks, and trend lines. By integrating these elements, the indicator aims to offer a holistic view of price action, helping traders identify potential entry and exit points, as well as key levels of interest in the market.
🔶 Key Features
Market Structure Analysis: The indicator includes a ZigZag feature to highlight significant market highs and lows, aiding in the visualization of market structure changes and trends.
Liquidity Sweeps Detection: It identifies and displays liquidity sweeps, which are crucial for recognizing potential market reversals and areas of interest where significant price action is likely to occur.
Order Blocks: Automatically detects and draws order blocks, highlighting areas of institutional buying and selling pressure, which can serve as key support and resistance levels.
Trend Lines: The toolkit can draw and extend trend lines based on pivot points, providing a clear view of prevailing market trends and potential breakout points.
Customizable Settings: Users can adjust various settings, including the length of the ZigZag, liquidity detection sensitivity, the number of order blocks to display, and trend line detection parameters, allowing for a tailored analysis experience.
🔶 Disclaimer
The "Price Action Toolkit Lite " is intended for educational and informational purposes only.
It is not financial advice and should not be construed as such. Trading in financial markets involves substantial risk, including the risk of loss.
Past performance is not indicative of future results.
🔷 Similar Scripts

STIC bullish and bearish hunter with FVGSmart Trading and Investment Companion (STIC) is a sophisticated tool designed to identify and visualize inducement, market structure, market trends, track liquidity, and project and forecast price action for all applicable assets. it has been tested to work on all timeframes and has been traded on stock, forex, and crypto assets.
This script is an upgraded version of previous STIC indicator, which you can use in addition to it or separately as you deem fit
Traders/ investor that are familiar with market structure, inducement, candlestick psychology, trend-following indicatorsand Fair Value Gap FVG will find it easy to adopt this trading and investment companion. As stated below, this is how it works.
Features and how to use
1st of all, after adding the indicator to yoursuperchart, you want to endusre to set your to so as to enable you see the text labeling clearly. to do that, after adding the indicator to your chart, right click it on the list, you will se the Visual order option.
Special Extreme Alert!
By analyzing the trends and dimensions, we are able to predict market extremes conditions, especially in pump and dump scenarios. (the bullish or bearish P/D extreme alerts).
Market flip arrow
The arrows trigger to indicate when the market flips to bullish (green) or bearish (red) conditions. note that this arrow is just a market flip confirmation and it it triggered by market trends, it does not come one time and sometimes later after market trigger conditions had been met.
circled in white.
Buy or sell potential {The tiny yelow(sell) and blue(buy) triangle}
By analyzing market extreme conditions, market sentiment, and liquidity, the buy/sell potential alert trigger is able to determine the state of the market, This can and should be used in combination with the market flip line (MFL) [the yellow line from , market flip trigger (MFT) (purple line), and market support/resistance line (MSR)(blue line) .
Market flip Line (Blue line) (MFL): the MFL is useful to also understand the market phase; a candle close above the MFL is bullish, while a candle close Below, the MFL is bearish. You are, however, expected to experience market retests and rejections coupled with support and resistance to follow through with the predicted direction. Patience is a valuable virtue in trading.
Extended sell or buy hunt (Red and Green Triangle)
this is real-time triangles indicator just like every other indicator on theis chart that indicates the market direction labeled with buy and sell. Note that the market-extended extreme can occur multiple times in the same direction. Hence, we'll advise having multiple trade entries.
The flip support line
Market Flip Trigger Line (MFTL) (Magenta): When the market crosses and closes below or above the Market Flip Trigger Line, you should wait for a confirmation. a confirmation is usually a retest or rejection of the line. A candle close and reject indicates the market as flip direction and it is going for a correction or major reversal. it is applicable on all timeframe.
As mentioned earlier, if you understand market structure and sentiment, using the uFVG, iFVG, upLQTY, downLQTY and BOS will be easy. however, this is how it works, you may need tohave and expanded readbout market structure for additional knowledge.
upLQTY (Bullish liquidity inducement)
The indicator appear at the close and confirmation on the 3rd candle and it is extended to only appear on 200 bars applicable on all timeframes.
This is a bullish sentiment and liquidty inducement order block that occurs, leading to the break of trend structure and change of character. Meaning the market sentiment as change which is backed up by liquidity in that region, which mostly gets filled, especially on lower timeframes before the price action continues. If price revese breaks and hold above this region, it invalidates the order block. This will always appear when there is a confirmed change of character CHoCH to the bullish side.
downLQTY (Bearish liquidity inducement) The indicator appear at the close and confirmation on the 3rd candle and it is extended to only appear on 200 bars applicable on all timeframes. It is and inverse of the upLQTY.
like order block, these are supply and demand zones that has the potential to change the direction of a trade. This is a bearish order block that occurs, leading to the break of structure and change of character. Meaning there is bearish liquidity yet to be accounted for in the region, which mostly gets filled, especially on lower timeframes before the price action continues. If broken, it invalidates the order block. This will always appear when there is a confirmed change of character from CHoCH to the bearish side.
Fair Value Gap
From general knowledge, FVG also know as Fair value gaps are inbalnace created by a 3 candlestick pattern where the top of the bottom candles doesn't cross the bottom of the top candle. like order block, these are supply and demand zones that has the potential to change the direction of a trade. This mostly indicate the presense of big plays in the market. for STIC indicator, FVG are labeled as listed below;
UFVG, also FVGup, {Colour green box} = bullish imbalance fair value gap
IFVG, aka FVGdown, {Red box} = bearish imbalance fair value gap
OIFVG, {Yellow box, no label} = other imbalances fair value gab
You should not that FG has upper, lower and middle band, any of the this area can be induced and filled by price.
Alert Conditions!
Buy alert conditions
- Any bullish buy alert
- Bullish hunt
- Re-entry Buy
- Sharp Market Sell rejection
- Buy potential
- upLQTY
Long position Exit conditions
- ExtremeB
- Profit
- Sell hunt
The Entry, exit and trail profit alert trigger should be used as position exit conditions either for a Long (Buy) or Short (Sell) situation and should be set as OPB (Once Per Bar). Using it as entry for exit or vice versa as shown not to be very profitable. hence the need to combine with other order entry alerts like the Any bullish or Bearish alerts
Sell alert conditions ( NOTE: All Sell alert are not yet included in this current version as this is targeted towards bullrun.)
- Sell potential
- Sell triangle (Sell hunt)
- downLQTY
and any trail profit alert, this alert put into consideration all the conditions required to trail profit.
Risk management advice
Patience and a good risk management strategy are required to be profitable trader using this tool. You need to ensure not to overleverage, and you should have multiple entries in case the buy coditions/alert shows again below the previous buy alert before a sell condition/alert occurs.

NormInvTargetSeekerNormInvTargetSeeker
The NormInvTargetSeeker is a trading tool designed to aid traders in identifying and capitalizing on Distribution and Accumulation zones, highlighting specific price levels that could serve as targets for future price movements. Although the indicator itself is not multi-timeframe, an effective trading strategy might involve signal validation across multiple timeframes.
🔶 USAGE
The indicator identifies Distribution and Accumulation zones, providing potential targets for future price moves.
Traders are encouraged to use these zones as profit targets or potential reversal points.
Confluence Zones
These zones are identified as regions where various factors or levels converge, signaling an increased probability of price reaction.
They can be used to reinforce signals or identify levels where price might encounter significant resistance or support.
🔹 Trading Strategy
First, identify a signal on your primary trading timeframe.
Manually check higher timeframes to ensure the signal aligns with them.
Use the identified zones, whether Distribution or Accumulation, as target zones for your trades.
🔶 Order Blocks
The NormInvTargetSeeker identifies "Order Blocks" by examining a specified number of consecutive candles with a specific condition: the current candle must completely engulf the previous candle. This means that both the high and low of the current candle are higher and lower, respectively, than the high and low of the previous candle, signifying a dominant move in the direction of the current candle.
🔹 Trading Strategy
Target Confirmation: Order Blocks can serve to confirm target points, providing additional validation for identified levels.
Market Insight: They offer crucial insights into whether "big hands" or institutional players are positioned as buyers or sellers in the market.
Traders can use Order Blocks as a means to validate targets or key price levels, observing if the price reacts significantly upon reaching these blocks.
They can also provide insights into the general market direction or underlying market strength by identifying where the major market players are placing their orders.
🔶 SETTINGS
The indicator allows users to adjust various parameters to customize the display and logic of the tool to fit their needs.
🔹 Display Settings
Users can customize the colors and displays of various zones and labels to match their preferences.
🔶 LICENSE AND CREDITS
This work is licensed under Attribution-NonCommercial-ShareAlike 4.0 International (CC BY-NC-SA 4.0). More information here: creativecommons.org
This indicator utilizes a TypeScript implementation of the Normal Inverse function as a reference, which can be found here : github.com
Special thanks to the authors of the referenced code for providing a foundation upon which this indicator was built.
🔶 UPDATES
Current Version: 1.0.0
For future updates, please check the comment section.
🔶 CONTACT
For any questions or suggestions, please feel free to contact @RickSimpson on TradingView.

SMC style josh )SMC style josh — FVG, OB, BOS/CHoCH, EQH/EQL, PD, HTF, Trendlines
What it does
A clean-room Smart-Money–style study that visualizes market structure and liquidity concepts:
Structure: BOS & CHoCH for swing and internal legs (width/style controls, preview of last pivots)
Order Blocks: internal & swing OBs with midline (50%), mitigated/invalid handling, optional auto Breaker creation
Fair Value Gaps (FVG): auto boxes with optional 50% line, ATR filter, extend length, and “after-CHoCH only” window
Equal High/Low (EQH/EQL): ATR-based proximity threshold
Liquidity Grabs: wick-through/close-back tags
Premium/Discount (PD) zones: live boxes + equilibrium line from latest swing range
HTF levels: previous Daily/Weekly/Monthly highs/lows with labels (PDH/PDL, PWH/PWL, PMH/PML)
Trendlines: auto swing-to-swing lines (liquidity)
Confluence Score: column plot summarizing recent events (+/− weighting)
Key options
Safety switch to pause all drawings
Per-module visibility, label sizes/colors, line styles/widths
ATR-based filters for impulses and gaps
Limits for lines/labels/boxes to avoid runtime errors
How to read
BOS = continuation break of the current leg; CHoCH = potential regime shift
OB mitigated when price returns into the block; invalid when price closes beyond; mitigated-then-invalid can form a Breaker
FVG is considered “filled” when price closes through the gap boundary (optional hide/gray-out)
Strong/Weak High/Low tags reflect the active swing bias (potential liquidity/targets)
Good practice
Combine with risk management, multiple timeframes, and your own rules. All drawings are for study/visualization; signals are not trade instructions.
Compliance / Disclaimer
This script is for educational and research purposes only. It is not financial advice or a solicitation to buy/sell any asset. Past performance does not guarantee future results. Always test and manage risk responsibly.
License / Credits
Built with Pine Script® v5. “SMC style josh” is an original, clean-room implementation and does not reuse third-party code.
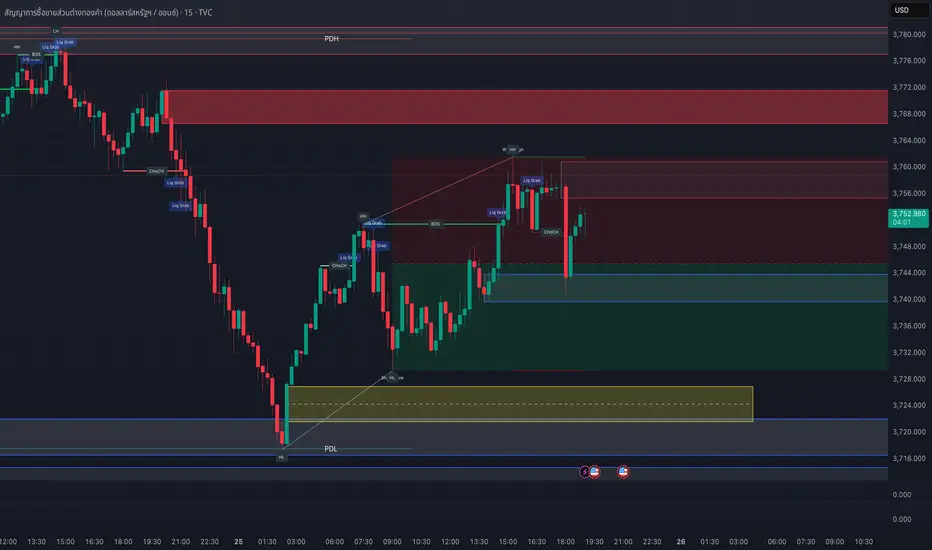
OrderBlock / FVG / BoS / Pivots (Multi-Tools) v 1.3Questo indicatore identifica e visualizza diversi pattern di price action utilizzati nel trading Smart Money Concepts (SMC). Ecco cosa fa:
Funzionalità Principali
-Order Blocks (OB) - Identifica blocchi di ordini istituzionali dove il prezzo potrebbe rimbalzare
-Fair Value Gaps (FVG) - Rileva gap di prezzo che potrebbero essere riempiti
-Break of Structure (BoS) - Segnala rotture di strutture di mercato importanti
-Rejection Blocks (RJB) - Trova zone di rifiuto del prezzo
-Premium Premium Discount Discount (PPDD) - Identifica order blocks formati dopo sweep di liquidità
Caratteristiche Aggiuntive
-Pivot Points - Visualizza massimi e minimi di mercato
-High Volume Bars - Evidenzia candele con volume anomalo
-Stacked OB+FVG - Segnala quando order block e fair value gap si sovrappongono
Personalizzazione
L'indicatore offre controlli completi per:
-Colori personalizzabili per ogni elemento
-Numero massimo di box visualizzabili
-Trasparenza e stili dei bordi
-Etichette e dimensioni
-Opzioni per evidenziare zone "mitigate" (già testate dal prezzo)
È uno strumento molto utile per trader che seguono la metodologia "Smart Money" e cercano di identificare dove gli operatori istituzionali potrebbero aver piazzato i loro ordini.
////////////////////////////////////////////////////////////////////////////////
This indicator identifies and displays various price action patterns used in Smart Money Concepts (SMC) trading. Here's what it does:
Main Features
-Order Blocks (OB) - Identifies institutional order blocks where the price could bounce
-Fair Value Gaps (FVG) - Detects price gaps that could be filled
-Break of Structure (BoS) - Alerts breakouts of important market structures
-Rejection Blocks (RJB) - Finds price rejection zones
-Premium Premium Discount Discount (PPDD) - Identifies order blocks formed after liquidity sweeps
Additional Features
-Pivot Points - Displays market highs and lows
-High Volume Bars - Highlights candles with abnormal volume
-Stacked OB+FVG - Alerts when order blocks and fair value gaps overlap
Customization
The indicator offers complete controls for:
-Customizable colors for each element
-Maximum number of displayable boxes
-Transparency and border styles
-Labels and sizes
-Options to highlight "mitigated" zones (already tested by the price)
It's a tool Very useful for traders following the "Smart Money Concepts" and trying to identify where institutional traders may have placed their orders.

OSOK [AMERICANA] x [TakingProphets]OVERVIEW
OSOK is an ICT-inspired execution framework designed to help traders map the interaction between Higher-Timeframe (HTF) liquidity sweeps, qualifying Order Blocks, and Current-Timeframe (CTF) confirmation signals — all within a single, structured workflow.
By sequencing an HTF CRT → Order Block → CTF CRT model and integrating IPDA 20 equilibrium context, this tool provides traders with a visual framework for aligning intraday execution decisions with higher-timeframe intent. All plotted elements — sweeps, blocks, open prices, and equilibrium levels — update continuously in real time.
Core Concepts (ICT-Based)
Candle Range Transition (CRT) Sweeps
Bullish CRT → The second candle runs below the first candle’s low and closes back inside its range.
Bearish CRT → The second candle runs above the first candle’s high and closes back inside its range.
These patterns are frequently associated with liquidity grabs and potential directional shifts.
HTF → CTF Alignment
-Detects valid HTF CRTs (e.g., Daily CRTs derived from H4 or Weekly CRTs derived from Daily).
-Locates a qualifying Order Block within HTF Candle-2 to identify areas of potential interest.
-Waits for a modified CRT confirmation on the current timeframe before signaling possible directional bias.
IPDA 20 Equilibrium
-Plots the midpoint of the daily highest and lowest prices over the last 20 periods.
-Provides a visual reference for premium and discount pricing zones.
How OSOK Works
Step 1 — HTF CRT Check
On each new HTF candle, the script scans for a clean CRT formation on the higher aggregation (e.g., H4 → D or D → W).
If found, it tags the candles as C1, C2, and C3 and optionally shades their backgrounds for clear visual parsing.
Step 2 — HTF Order Block Identification
Searches within HTF Candle-2 for a qualifying Order Block using a compact pattern filter.
Draws a persistent OB level with clear labeling for context.
Step 3 — CTF Confirmation (Modified CRT)
Monitors your current chart timeframe for a modified CRT in alignment with the HTF setup:
For bullish setups → waits for a bullish modified CRT and close above C1’s high zone.
For bearish setups → expects a bearish modified CRT and close below C1’s low zone.
Step 4 — Real-Time Maintenance
All labels, lines, and background spans update intrabar.
If the setup invalidates — for example, if implied targets are exceeded before entry — the layout resets and waits for the next valid sequence.
KEY FEATURES
HTF CRT Visualization
-Optional “×” markers on Daily/Weekly CRT sweeps.
-Independent background shading for C1, C2, and C3.
Order Block + Open Price Context
-Draws HTF Order Block levels and plots C3 Open Price (DOP) for additional directional reference.
CTF CRT Execution Cue
-Displays a modified CRT on your current timeframe when conditions align with the HTF narrative.
IPDA 20 Line + Label
-Plots a dynamic midpoint level with an optional label for quick premium/discount context.
Optimized Drawing Engine
-Lightweight, efficient use of chart objects ensures smooth performance without visual clutter.
INPUTS
-Higher Timeframe Settings
-Toggle markers for Daily/Weekly CRT sweeps.
-Enable and color C1, C2, and C3 background spans.
-IPDA Display Options
-Control visibility, color, and line style for IPDA 20 equilibrium levels.
-Sweep, OB, and Open Price Styles
-Per-element customization for colors, widths, and labels.
BEST PRACTICES
Start on H4 or Daily to identify valid HTF CRT formations.
Confirm a qualifying OB inside Candle-2.
Drop to your execution timeframe and wait for the modified CTF CRT confirmation before acting.
Use IPDA 20 equilibrium as a reference for premium vs. discount zones.
Combine with your ICT session bias and overall market context for optimal decision-making.
Important Notes
OSOK is not a buy/sell signal provider. It’s a visual framework for understanding ICT-based execution models.
All objects reset automatically when new HTF candles form or setups invalidate.
Works on any symbol and timeframe by default, with HTF mapping set to H4 → D and D → W.

ICT SMC Custom — BOS/MSS + OB + FVGWant me to fill that box? Here’s a ready‑to‑paste description for your publish screen:
⸻
ICT SMC Custom — BOS/MSS + OB + FVG (Crypto‑friendly)
A clean Smart Money Concepts tool that marks Break of Structure (BOS), Market Structure Shift (MSS), Order Blocks (OB), and Fair Value Gaps (FVG) with bold, easy‑to‑see visuals. Built for crypto but works on any market and timeframe.
What it does
• BOS & MSS detection with optional body/wick logic
• Order Blocks: auto‑draws the last opposite candle before a BOS, keeps only the most recent N, and fades when mitigated
• FVGs: 3‑candle gaps with a minimum size filter and a cap on how many to keep
• HTF Swings (optional): plots higher‑timeframe pivot highs/lows for top‑down context
• Alerts for BOS/MSS and FVG formation
Inputs
• Swing pivot length (default 3): sensitivity for structure pivots
• Use candle bodies for breaks: close vs level (on) or wicks (off)
• Show BOS/MSS labels, Show FVG, Show Order Blocks
• Min FVG size (ticks) and Max boxes to keep for FVG/OB
• OB uses candle body: body range vs full wick range
• Show higher timeframe swings + HTF timeframe
• Bullish/Bearish colors
How it works
• BOS triggers when price breaks the last opposite swing.
• MSS flags when the break flips the prior bias.
• OB is the most recent opposite candle prior to BOS; it’s marked and later greyed out once price closes through it (mitigation).
• FVG is detected when candle 1’s high < candle 3’s low (bear) or candle 1’s low > candle 3’s high (bull).
Alerts included
• BOS Up / BOS Down
• MSS Up / MSS Down
• FVG Up / FVG Down
Tips
• Start on 15m/1h for crypto, pivot length 3–5.
• Turn Use candle bodies ON for stricter confirmations, OFF for more signals.
• If boxes look cluttered, lower “Max boxes to keep.”
Note: This is a visual/educational tool, not financial advice. Always confirm with your own plan and risk management.
